by Owen Mundy
Introduction
The following essay describes an artistic/public-intervention concept developed in response to the proliferation of networked sensors in public and private spaces. Rather than produce the work alone, I decided to initiate the idea as an assignment in my Physical Computing course in the Department of Digital Studies at Davidson College. The idea draws on multiple histories and issues corresponding to the rise of IoT devices in our world including, 1) the deadly military provenance of networked sensors, 2) the nefarious origins of precious metals required to produce such devices, and 3) the plethora of security and privacy issues these machines introduce into our lives. The essay discusses these issues to provide context, followed by the assignment prompt, and concludes with images and source code from student outcomes.
Part 1: Context
Operation Igloo White
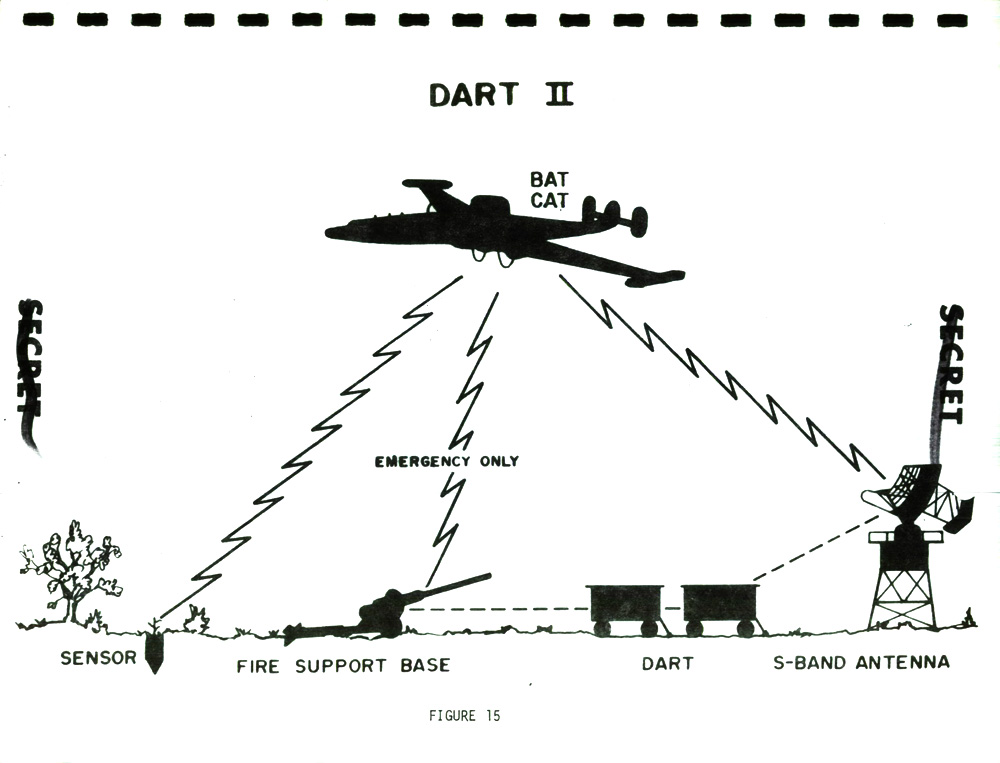
From 1967–1972 the U.S. Air Force ran a covert program of electronic warfare in order to disrupt a military supply route called the Ho Chi Minh Trail, which enabled support from North Vietnam and Cambodia to flow into South Vietnam. This enterprise, code-named “Operation Igloo White,” combined electronic sensors, radio communication, and computer processing to automate intelligence collection to inform and direct military action. The project incorporated more than 20,000 acoustic, seismic, and other sensors, airdropped in an attempt to halt the flow of war supplies from the north into South Vietnam. When tripped, in less than five minutes, data from the sensors was relayed by planes flying overhead to computer analysts at a base in Thailand, who called in airstrikes at the location of the sensors (Figure 1).

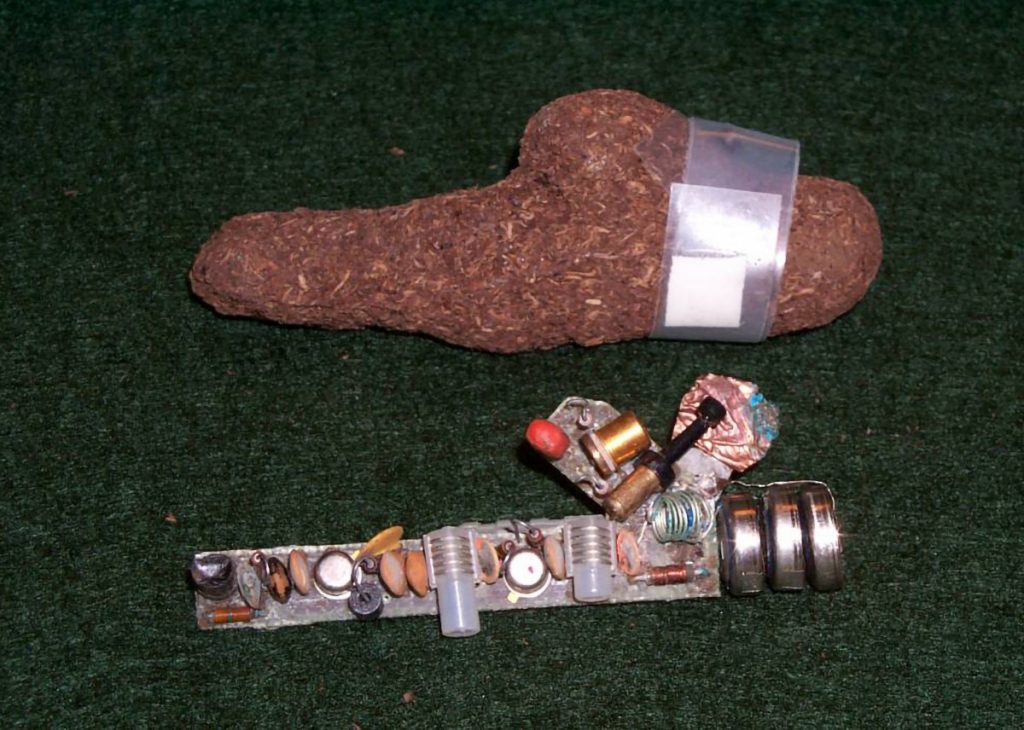
Another seismic sensor that shared a unique disguise (and challenges) was the T-1151 TURDSID (Figure 3). This device consisted of a vibration sensor, a transmitter and antenna, and batteries, and was small enough to fit into a small rubber case disguised to look like dog excrement, thus its name. Due to its size the batteries lasted only a few days, and required another, larger sensor nearby to relay their signal. Consequently, these were an expensive and temporary solution to the problem of detecting activity along the supply route. While the disguise was later modified after learning there were no dogs running wild along the Ho Chi Minh Trail5 Haider, 50. this device still assumes a prominent position among celebrated surveillance apparatus for its unorthodox disguise.
While an expensive technological failure for the U.S. military, as one of the first real-time computer-driven surveillance operations, Igloo White should be seen as an instrumental development in the history of IoT. After its demise, R&D from Igloo White returned to the U.S. where it was deployed along the Mexican border, forming the basis of an ongoing surveillance program. Further, evidence of the research for this once covert operation can be found not only in the modern electronic battlefield and border operations, but in battery, wireless communication, and other electronic components of consumer goods produced by the private corporations who worked on Igloo White. The ADSID was produced by the Sandia Corporation6Haider, 46. , a subsidiary of Honeywell, which today manufactures a variety of related products like smart thermostats, connected home security systems, and even cluster bombs. Other Igloo White sensors like the MICROSID and HELOSID were produced by Texas Instruments, maker of digital calculators, the “Speak & Spell” learning toy, and an abundance of weapons and armament systems for the U.S. military.
Precious Metals – Poisonous origins
With the rise in demand for both military and consumer electronic devices comes myriad unseen environmental and human costs. The raw materials required to make modern electronics are often toxic or must be mined in remote locations under extremely difficult conditions. Take, for example the Apple iPhone; with over 1.2 billion manufactured since 2007, it is one of the most groundbreaking, capable, and prototypical connected devices that exist. However, examining its materials shows the degree to which its manufacture depends on extracting both materials and human labor from the third world.
The bulk of the iPhone’s weight comes from non-precious materials: aluminum (24.1%), carbon (15.4), oxygen (14.5%), iron (14.4%), silicon (6.3%), copper (6.1%), cobalt (5.1%), hydrogen (4.3%), chromium (3.8%), and nickel (2.1%) (Merchant, 2017: 5). The remaining 3.9% of the device contains traces of materials that are toxic like lithium (.7%) or lead (.03%), or are considered valuable because of the difficulty in retrieving them. The most valuable material at >$40/gram is gold (.01%). Along with lead and zinc (.5%), tin (.5%), an integral part of the solder that connects components in the circuits, is extracted from mines in rural South America under dangerous or deadly conditions. These mines operate without regulation, and do not provide health or disability insurance, workers compensation, or other protections for workers. Further, they often employ children as young as six to collect minerals from the tiniest spaces. One mine in Potosí, Bolivia, where tin from your smartphone might have originated, was found to employ as many as 3,000 children in its depths7Merchant, B. (2017). Everything That’s Inside Your iPhone. Motherboard Magazine. Retrieved from https://motherboard.vice.com/en_us/article/433wyq/everything-thats-inside-your-iphone . According to one report, the smallest humans are not only strategic, but the most vulnerable, with over sixty children killed in accidents in a single mine in Potosí in 20088Enzinna, W. (2013) Unaccompanied Miners: Down the Shaft with Bolivia’s Child Laborers. Vice News. Retrieved from https://www.vice.com/en_us/article/av38yb/child-workers-of-the-world-unite .
The iPhone example reveals multiple paradoxes at work in the production of consumer electronics and IoT devices. At the time of this writing, Apple is the most profitable publicly-traded company in the world, yet its enormous profit depends on extracting value from the land and peoples of the third world, including those least fortunate among us. The market value of raw materials used in a single iPhone total only $1.03, with 56% of the cost the tiny amount of gold inside9Merchant, 2017:5.. While the marketing language around such devices often promotes efficiency and convenience, the human cost of extracting the raw materials remains large, and their capture is anything but convenient. This is only one example of the “carbon capitalism” phenomenon, where the first world profits thanks to economic disparities and extraction of third world resources. In the final example the essay will address disproportionate profit via another form of raw material; the collection and exchange of personal data.
Surveillance Capitalism and the IoT
As IoT devices continue to invade our lives under the pretense of convenience their continuous presence enables new forms of extraction and disproportionate power relationships. Shoshana Zuboff calls the accumulation of profit using data to predict and modify human behavior, “Surveillance Capitalism.” She states, as a result of increasingly automated and “informated” spaces, where we live, work, and sleep, “more and more data will be generated about individuals and will persist under the control of others.”10Zuboff, S. (2015). Big other: surveillance capitalism and the prospects of an information civilization. Journal of Information Technology, 30(1), 75–89. https://doi.org/10.1057/jit.2015.5 At issue is not only the barrage of duplicitous advertisements that use our data to tap into desires we don’t even know we had11Ellenberg, J. (2014). What’s Even Creepier Than Target Guessing That You’re Pregnant ? Slate, 4–7. Retrieved from http://www.slate.com/blogs/how_not_to_be_wrong/2014/06/09/big_data_what_s_even_creepier_than_target_guessing_that_you_re_pregnant.html (p.3) , but how this system that uses our information to hold power over us permeates our lives, is entrenched in our social fabric and condemns us further into the depths of a surveillance society.
Like the smartphone, IoT brings this “home”, invading our personal spaces and passively watching us under the cover of efficiency. The security and privacy implications of these devices we have been convinced are necessary are endless. Imagine how Google might (or already does) use data from its “Nest” device. This so-called “smart thermostat,” knows where you are in the house, your current temperature setting, and combined with the youtube video you are currently watching, can generate very specific YouTube advertisements. Above and beyond the common practice of targeted behavioral tracking, big data analytics are being used to generate consumer models and applying those predictions to your visual space: how might your physical properties like body temperature, or the last time you visited your connected refrigerator or any other IoT-extracted surveillance be used to change not just what you see or purchase, but what issues you value, who you vote for, or even how you allow yourself to think?12Anonymous (2018). The Internet of Things has a dirty little secret: it’s not really yours, 1–7. Retrieved from https://www.technologyreview.com/s/601013/the-internet-of-things-roadmap-to-a-connected-world/
Beyond the larger shift into a society where this is acceptable, what about questions regarding potential egregious uses by individuals or groups who intend to do direct harm? There is no shortage of reports of human rights abuses due to state-sponsored dataveillance in countries like Iran, Egypt, and China; examples orchestrated thanks to technology from western countries13 Privacy International. The Right to Privacy in Egypt. (2014). Retrieved from https://privacyinternational.org/advocacy-briefing/775/right-privacy-egypt . Reports of similar patterns of domestic abuse exist thanks to smart home technology where Internet-connected devices have been used to harass, monitor, and enact even more monstrous power over others. As more IoT products emerge so do the examples of abuse, like remotely changing someone’s thermostat to extreme temperatures, posting intimate images captured by devices for revenge, or locking people out of their homes14 Bowles, N. (2018). Thermostats, Locks and Lights: Digital Tools of Domestic Abuse. The New York Times, pp. 1–5. Retrieved from https://www.nytimes.com/2018/06/23/technology/smart-home-devices-domestic-abuse.html. Unlike a corporation that has a positive image to project, perpetrators have remotely-controlled IoT devices to assault their victims in a shocking example of “feature creep” that finds off-the-shelf devices are also quite adept as a means of creating terror.
Part 2: Project Prompt
Let’s move now to the instructions for “listening stations,” which gets its name from a symbol of state and corporate power through information gathering, the NSA post atop the Teufelsberg west of Berlin, Germany.
Description
The following asks you to respond to these histories and contradictions by making your own “listening station” to symbolize and engender discussion around these issues. Like the Igloo White sensors, your work will be disguised in a modestly absurd way, and like the devices above, you will monitor “human activity”.
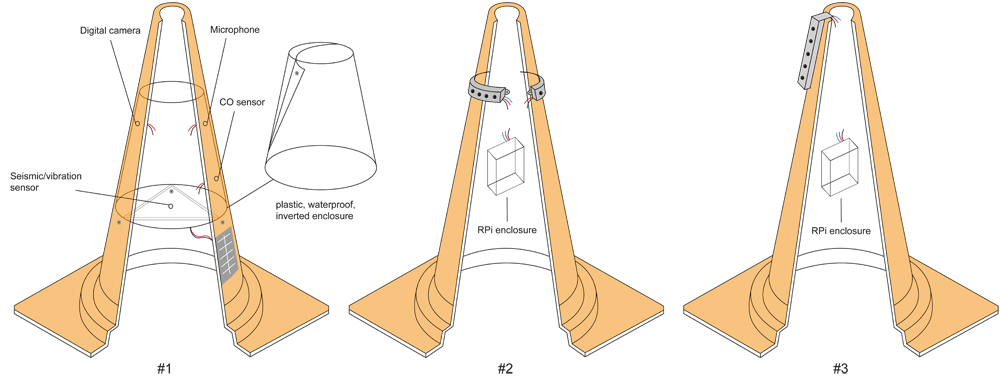
Instead of a weather station that senses natural phenomena, your work will log data specific to how humans impact the world. Your device should therefore be placed in a public space, near people, and the data you collect should be relevant to the disguise you adopt. For example in a design (Figure 4) for a traffic cone disguise, the sensors might collect images, noise pollution (volume), carbon dioxide emissions, and seismic vibrations from vehicles.
Finally, you’ll visualize the data (photographic, quantitative, qualitative) you collect from these stations in order to measure, analyze, and discuss ongoing effect of humans on the world, and write a short white paper explaining your research, process, and outcomes.
This ironic take, reproducing and escalating the “problem,” employs a subversive strategy commonly used by The Yes Men and others that Slavoj Žižek calls “overidentification.”15Žižek, S. (1993). Why Are Laibach and Neue Slowenische Kunst Not Fascists? The Universal Exception: Selected Writings, Volume Two, 63-66. This method playfully enacts the “worst option” which, on its surface, appears to contradict a positive response in order to overemphasize a position and follow anti-humanist positions to their ultimate ridiculous end, thereby calling those positions into question.16BAVO. (2007). Always Choose the Worst Option – Artistic Resistance and the Strategy of Over- Identification. In BAVO, G. Boie, & M. Pauwels (Eds.), Cultural Activism Today: The Art of Over-identification. Rotterdam: Episode Publishers. Retrieved from http://xenopraxis.net/readings/bavo_overidentification.pdf Overidentification offers to its audiences the most extreme form of a system revealing how, in our case, IoT devices are clandestine human surveillance apparatuses at their core, and should be considered within various histories of such technologies.
Suggested Process
The following was proposed as a process for executing this work, along with example outcomes from students.
1) Research: Read through this essay’s citations. Examine the histories and technologies of similar works, both the avant garde and everyday. Follow your own interests in these subject(s).
2) Develop your idea: How will you sense (direct or indirect) effects of humans? How does your data relate to your disguise? How might your audience perceive the object? Create three different ideas. Don’t worry about technical viability yet, be imaginative.

3) Create a proposal: Pick one idea and draw an illustration of it. Research the technical components you need. You are constructing a new device, but it is likely you will find the “pieces of your puzzle” have already been created and documented online. Share it with friends for feedback and viability.
Technical note: There are many ways to collect data using electronic sensors and microcontrollers like the Arduino or single-board computers like the Raspberry Pi. There is the potential to teach a whole class on electronics and sensor data, however, because the hardware and code is specific to the idea being implemented, it is not possible to go into detail on the technical information here. Instead an overview of what was used in the class example is provided, and links to the resources at the end of the essay.
In the spring 2018 class we used the Raspberry Pi v.3 (or “Pi”). It is more powerful than the Arduino, and has built-in wifi and an SD card for storing data. The Pi runs Linux (like MacOS and most web servers), making it easier to choose among several programming languages for connecting to the sensors.17Finley, K. (2016). Linux Took Over the Web. Now, It’s Taking Over the World. Wired, 1–5. Retrieved from https://www.wired.com/2016/08/linux-took-web-now-taking-world/ Then, rather than wire and test each sensor individually, a “plug and play” method called the GrovePi+ was employed to connect sensors and actuators to a HAT (“Hardware Attached on Top”) on the Pi, thus requiring no soldering.
4) Prototype: Start small; get individual components working on their own first. When the pieces are working properly start putting them together.
Technical note: Once you have your hardware set you’ll need to write code to test the sensors and collect the data. We used Python, a programming language that is accessible and popular among scientists and open source communities. The flowchart at the beginning of this chapter shows a good overview of how a program might work, collecting, processing, and outputting data. In this case, the student used a camera, microphone, and light sensor, then analyzed the camera images with OpenCV (a Computer Vision tool) to identify nearby people.
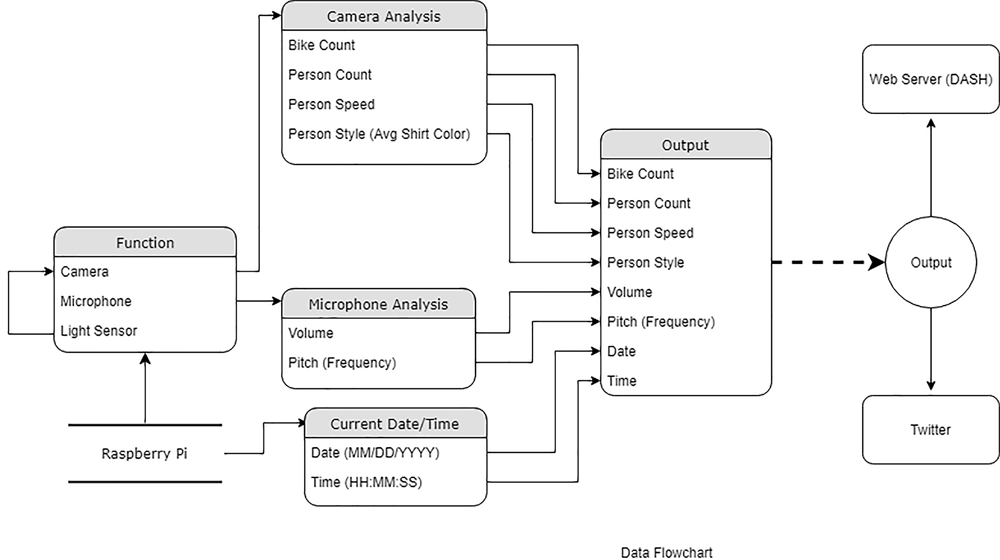
The flowchart at the beginning of this chapter is part of Tucker Craig’s A.T.H.E.N.A. (Automatic Tweets Humans Environmental Noise Analysis), a modified garden decoy owl to analyzed human visual and aural impact. This sentient owl monitored people as they passed, noting how noisy they were and, using a concealed camera and computer vision, counted them and determined fashion trends. Every two hours, A.T.H.E.N.A. added a new “tweet” to @NotYourAvgOwl explaining the amount of human traffic, the state of noise pollution, and the average color of pedestrians’ shirts.
5) Deploy the object: Make the object watertight so electronic components are not damaged. Get permission where necessary before you place the object. Don’t collect data about others you wouldn’t like collected about yourself. Avoiding collecting Personally-identifiable information will also allow you to avoid institutional review (IRB) if you are performing this in an institution.
6) Visualize the data: This could be as simple or as technical as you like and might include charts, graphs, timelines, or photographs.
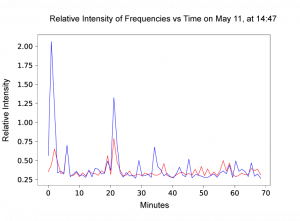
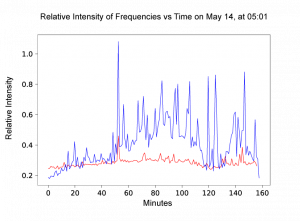
For example, these graphs (Figure: 7) were created by Ted Yoo in his Spybird project (Figure 8) to investigate any correlation between increases in human sounds and potential resulting decrease in bird song intensity. To do this, Yoo recorded sound with a microphone and performed Fast Fourier Transformations (FFT) on the audio to separate the human activity (typically 80–255 Hz) from bird calls (which average 4000 Hz). He found instead a positive correlation between the two, leading him to assume there may be other factors causing increases and decreases in both.

7) Document and share your work: Write a short statement explaining how your work addresses the issues outlined in the beginning of this essay. Describe your process. Include your research, drawings, technology, and images of your listening station. If you post your outcomes online share them with related hashtags #listeningstation #IoOPT
Conclusion
The increasing use of embedded computers to track our bodies, speech, and sentiments is a relatively new phenomenon in everyday life. The title of this essay, a reference to similarly-named NSA facilities dedicated to data collection by state agents, intends to capture how this shift to a surveillance society coincides with military developments. This transition from manual to automated surveillance introduces a new world where everything we do is recorded and monetized in order to influence our personal, economic, and political actions. The examples, including private companies producing sensors to prompt unrestrained military power, the richest electronics companies in the world devaluing human lives in order to extract raw materials at the cheapest rate possible, and the extraction of personal data for financial gain, evidence how, thanks to networked computers, our fascination with technology is accelerating a centralization of power. The “assignment,” to create and deploy, in a public space, a speculative yet functional device that senses, collects, and displays information about human activity, asks participants and their audience to examine the political and cultural contexts of electronics, and connect the issues to the devices themselves, which are inseparable from their position and influence on humanity.
Further readings
Caine, P. D. (1936). Project CHECO Southeast Asia Report. Igloo White, July 1968 – December 1969 (Vol. 3725). Retrieved from http://www.dtic.mil/dtic/tr/fulltext/u2/a485166.pdf
Hill, K., & Mattu, S. (2018). The House That Spied on Me. Gizmodo. Retrieved from https://gizmodo.com/the-house-that-spied-on-me-1822429852
Kester, G. H. (2005). Conversation pieces: The role of dialogue in socially-engaged art. Theory in Contemporary Art since 1985, 76–88.
Nissen, M. (2018). Unseen Sensors : Constantly Sensing but Rarely Seen. Designmind, (5), 1–21. Retrieved from https://designmind.frogdesign.com/2014/05/unseen-sensors-constantly-sensing-rarely-seen/
Oliver, J., Savičić, G., & Vasiliev, D. (2011). The Critical Engineering Manifesto. The Critical Engineering Working Group. Retrieved from http://criticalengineering.org/ce.pdf
Sarma, S. (2016). The Internet of Things: Roadmap to a Connected World. MIT Technology Review, 1–11. Retrieved from https://www.technologyreview.com/s/601013/the-internet-of-things-roadmap-to-a-connected-world/
Electronics Resources
Collin’s Lab, an excellent youtube playlist with a deep yet fun dive into what all those electronics components actually do, where they came from, and what they’re good for:
https://www.youtube.com/watch?v=aOJuCYgmPPE&list=PLDE23FAC8A681FA46
The GrovePi kit by Dexter Industries
https://www.dexterindustries.com/grovepi/
Source code
A.T.H.E.N.A. by Tucker Craig
https://github.com/tucraig/phys-comp-final
Spybird by Ted Yoo
https://github.com/TY117/Spybird